|
|
150 |
|
|
|
|
value can be calculated.
If the output of the retrieval strategy depends on a parameter, such as rank position or co-ordination level (the number of terms a query has in common with a document), it can be varied to give a different table for each value of the parameter and hence a different precision-recall value.
If [[lambda]] is the parameter, then P[[lambda]] denotes precision, R[[lambda]] recall, and a precision-recall value will be denoted by the ordered pair (R[[lambda]] , P[[lambda]] ).
The set of ordered pairs makes up the precision-recall graph.
Geometrically when the points have been joined up in some way they make up the precision-recall curve.
The performance of each request is usually given by a precision-recall curve (see Figure 7.1).
To measure the overall performance of a system, the set of surves, one for each request, is combined in some way to produce an average curve.
* For a derivation of this relation from Bayes' Theorem, the reader should consult the author's recent paper on retrieval effectiveness[10].
Averaging techniques
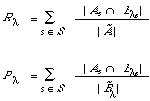
The method of pooling or averaging of the individual P-R curves seems to have depended largely on the retrieval strategy employed. When retrieval is done by co-ordination level, micro-evaluation is adopted. If S is the set of requests then:
where As is the set of documents relevant to request s. If [[lambda]] is the co-ordination level, then:
where B[[lambda]]s is the set of documents retrieved at or above the co-ordination level [[lambda]]. The points (R[[lambda]] , P[[lambda]] ) are now calculated as follows:
Figure 7.2 shows graphically what happens when two individual P-R curves are combined in this way. The raw data are given in Table 7.1.
An alternative approach to averaging is macro-evaluation which can be independent of any parameter such as co-ordination level. The average curve is obtained by specifying a set of standardrecall values |
|
|
150 |
|
|
|


