|
|
152 |
|
|
|
|
for which average precision values are calculated by averaging over
all queries the individual precision values corresponding to the
standard recall values.
Often no unique precision value corresponds
exactly so it becomes necessary to interpolate.
Interpolation
Many interpolation techniques have been suggested in the literature. See, for example, Keen[11].
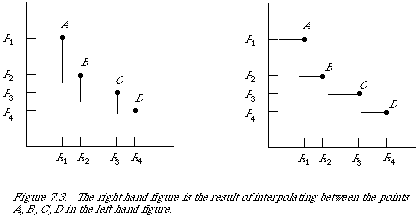
Figure 7.3 shows a typical P-R graph for a single query. The points A, B, C and D, I shall call the observed points, since these are the only points observed directly during an experiment the others may be inferred from these. Thus given that A = (R1, P1) has been observed, then the next point B is the one corresponding to an increase in recall, which follows from a unit increase in the number of relevant documents retrieved. Between any two observed points the recall remains constant, since no more relevant documents are retrieved.
It is an experimental fact that average precision-recall graphs are monotonically decreasing. Consistent with this, a linear interpolation estimates the best possible performance between any two adjacent observed points. To avoid inflating the experimental results it is probably better to perform a more conservative interpolation as follows:
Let (R[[lambda]] , P[[lambda]] ) be the set of precision-recall values obtained by varying some parameter [[lambda]]. To obtain the set of observed points we specify a subset of the parameters [[lambda]]. Thus (R[[theta]] , P[[theta]] ) is an observed point |
|
|
152 |
|
|
|
